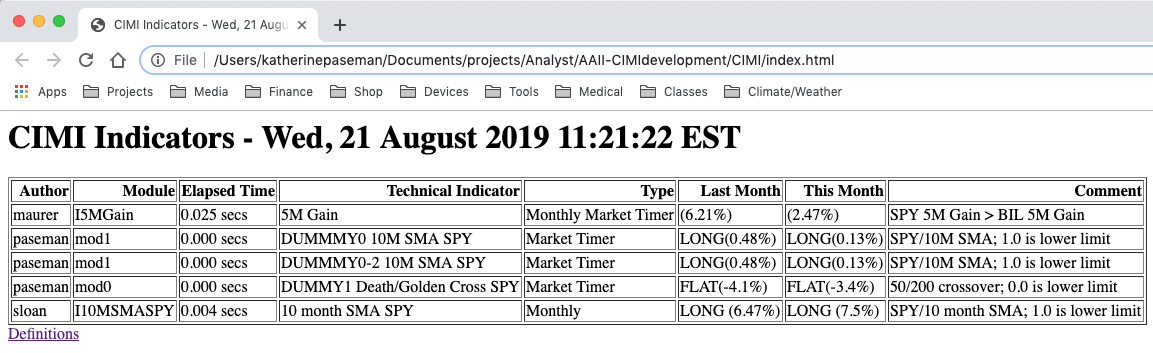
This document describes the structure and function of a Financial Indicator page (reproduced above), which provides a shared, realtime view of the economy and stock market via "Indicators" (metrics) on their condition. This indicator view was inspired by the monthly status reports provided by Al Zmyslowski at the AAII Silicon Valley CIMI meetings through March of 2019. Though limited, a minimal version of this page is already live and functional here. The Indicator page is generated by a python execution environment running in an "always on", internet accessable, 1&1/IONOS shared server. Each row on the Indicator page's table displays one independent "Indicator", which in turn maps to a single (python) code module. (A single module may produce multiple indicators however.) Though each Indicator functions differently, each takes data in a common input format and produces results in a common output format.
The Indicator page is generated using a REP (Read, eval, print) loop every 5 minutes, from 9am to 3:55pm EST (and once at 7pm EST), Monday through Friday, using the following crontab entry.
*/5 09-15 * * 1-5 /usr/bin/php /.../paseman/CIMI/refresh.phpRefresh can also be forced at any time via this "refresh" url.
In detail, the REP loop
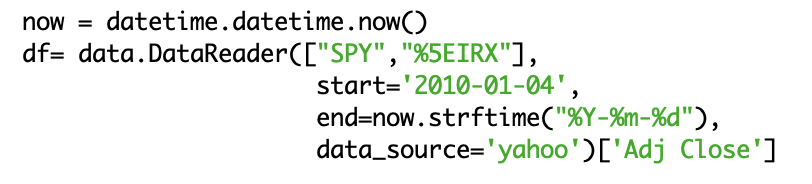
The environment first creates a pandas_datareader Dataframe containing daily quotes downloaded from yahoo. E.g.
As mentioned, although the processing varies, module I/O structure is identical for all indicators.
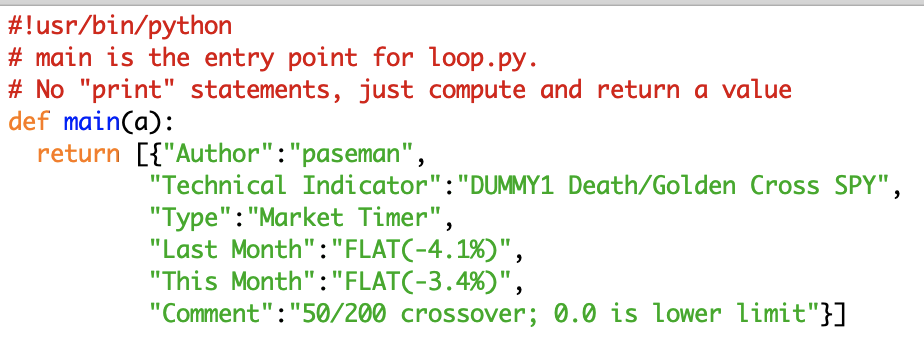
mod0 (below) is the simplest example of such a module. Here, mod0's "main" procedure ignores the passed argument and returns a list containing a single python dictionary of dummy results. This "row" of returned results is common to all the modules. It consists of 6 "fields": "Author","Technical Indicator","Type", "Last Month","This Month" and "Comment". Note that these field names correspond to the column header of the Indicator page's table.
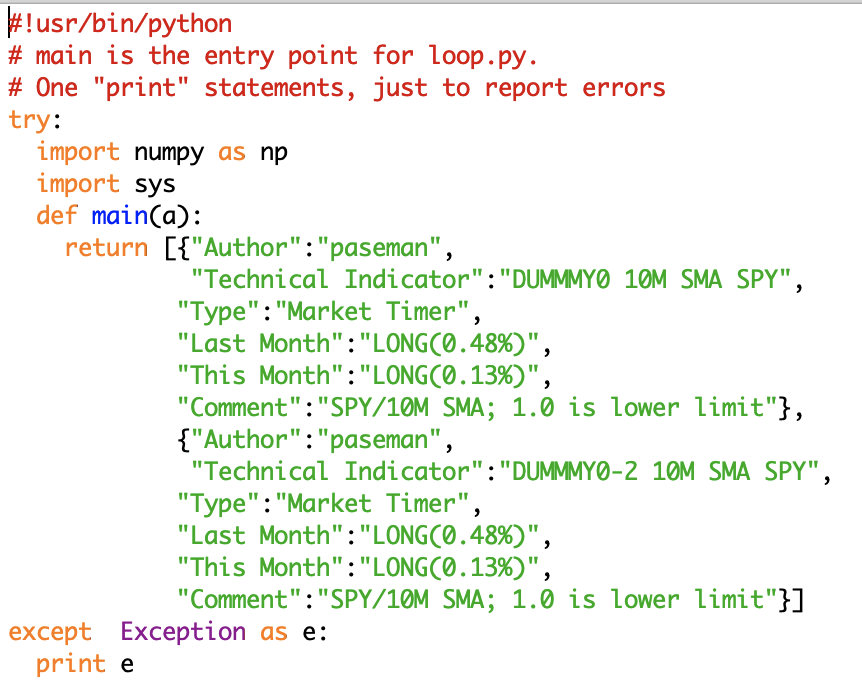
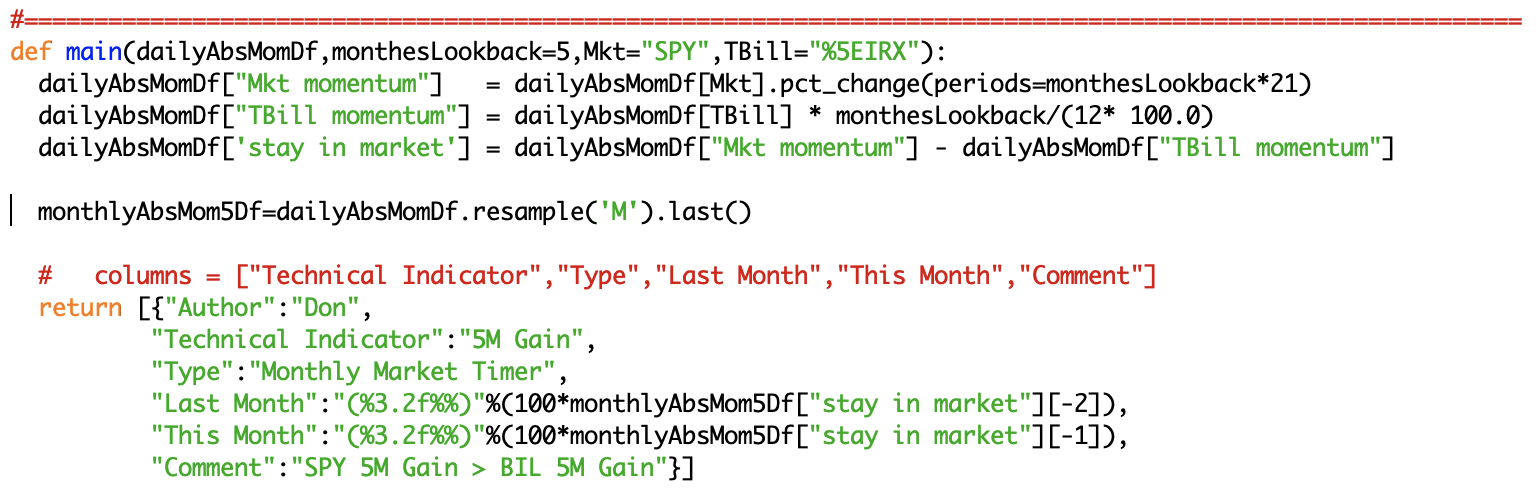
Although this works, I prefer mod1's structure (below). Here, everything is wrapped in a try/except block. This lets the execution environment pass any errors back to the main page, which will unceremoniously print them in the browser. If this is left out, and the module core dumps, there is no clue as to why. Note also that whereas mod0 returned a single indicator, mod1 returns two.
The line below creates a new column ("TBill momentum") which is equal to another column (TBill, which contains ^IRX closing prices) times monthesLookback (=5) divided by 12*100.
The line below creates a column called 'stay in market' by subtracting column "TBill momentum" from column "Mkt momentum".
The line below is just a little more complicated. It uses a pandas function called 'pct_change' to reproduce a common excel pattern where one puts daily pricing data in column 'A' and then determines percentage price change over 105 (5*21) days in column 'B'. In thia case, cell B120 contains '=(A120/A115 - 1)'.
Finally, the line below takes the dataframe of daily data (which has now been augmented with "Mkt momentum", "TBill momentum", and 'stay in market' columns) and "resamples" it monthly, retaining the last value of the month. As an aside, besides .last(), resample("m") could also apply .first(), .high(), .low(), .max() and .min() to each monthly range of values as well.
Robert Sloan's indicator is also incliuded in the prototype.
This example downloads just two tickers. However, I have created a 255 ticker Dataframe that contains nasdaq100 and other CIMI favorites. When including Open, Close, high, low, adjusted close since 2010-01-04, it weighs in at 58 Mb.
We could pass additional default arguments to each module beyond the ticker data, such as date the data was recorded (record_date), last_EOM_date and previous_EOM_date. This would allow an outer loop calling each module to create a time history of predictions. Note that modules are all in the same name space and so can call one another (as in the above "Composite Timer" example). However, if we are not careful, this could make results non-reproduceable. E.g. module1 calls module0 after module0 has changed. This means we need to introduce versioning if we want to both have modules call one another and maintain reproduceability.
We could incorporate input widgets (e.g. one that lists the start date for analysis) on the refresh link. However, note that there is just one (slow) computer backing this up. If too many instances are running on the backend, the system will not be responsive and may crash. As such, we simply regen a static indicator page using a cron task every 5 minutes.
Note that although the "returned dictionary" permits multiple different results to be reurned, we need to agree on what types of results there are and how they are to be interpreted.
One obvious output type is graphics, however I cannot currently import matplotlib. When matplotlib is available, modules will store plot files locally and pass file references back to the execution environment in the returned dictionary. In order to insure visual coherence, the evaluator will create a section below the html table where it will display the indicator title followed by html img tags pointing to whatever extra graphics each indicator returns.
A composite timer takes several simple timers as inputs and creates a composite score using a formula of the form: ( frac1 + frac2 +...+ fracN)/N where each timer can give a fraction from 0-1. Of course, an author can implement several timers in one module and return a list of individual indicators. Alternatively, they can implement composite timers using these steps:
First implement each simple timer as an indicator (python module) with a known module name e.g. ('A','B',...) as described above.
Next, require that each simple timer implement both "main" and a second entry point called "history" which returns a single column dataFrame, indexed by day. A composite timer then, is just an indicator that runs the following code:
Comments welcome.