20181126 Recommendation Analysis
I looked look at the last 7 years my Houston Broker's Energy Stock recommendations (e.g. here) using a program that
- Downloaded all the pdf files he sent me from gmail
- Extracted the 'Not Covered','Underperform','Market Perform','Outperform','Strong Buy' recommendations from each pdf (See here).
- Calculated the 6 month return of the respective stock compared to the S&P.
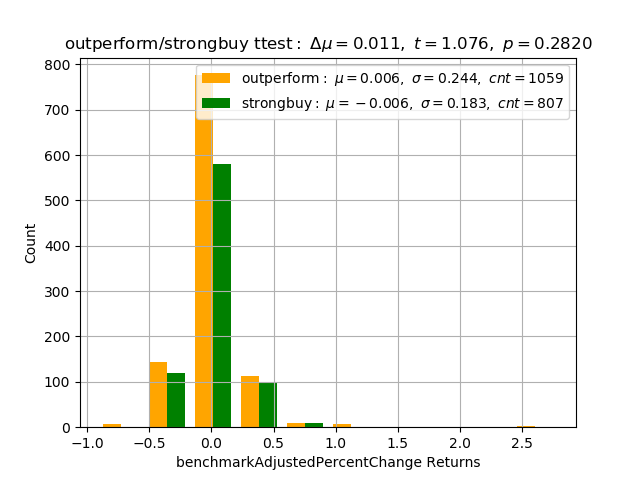
- Ran a statistical significance test (t test) comparing the 'Outperform' group to the 'Underperform','Market Perform','Strong Buy' groups.
The goal of this test was to see if recommendations were random, or whether they differed significantly from one another.
I need to double check the results, but here is what I got so far. In brief.
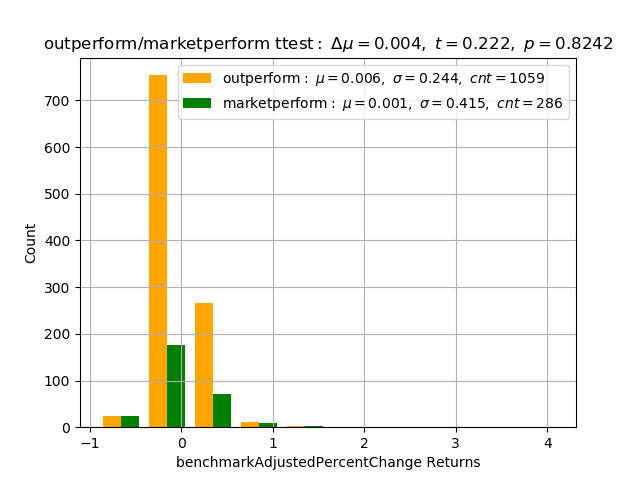
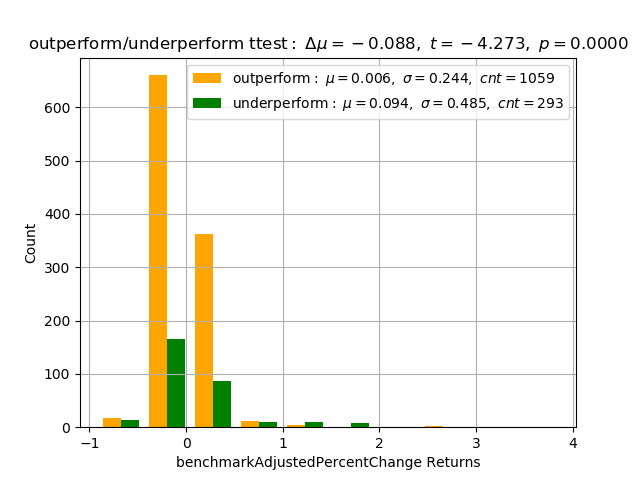
- The Outperform recommendation group performed 0.6% better than the S&P over 6 months
- The Strong Buy recommendation group performed 0.6% worse than the S&P over 6 months
- The Market Perform recommendation group performed 0.1% better than the S&P over 6 months
- The Under perform recommendation group performed 9.4% better than the S&P over 6 months (!).
It also shows a strong t test result, implying that the performance difference is real, not due to statistical fluctuation.
I still need to find out why. E.g. it might be "survival bias", which means that the program disregards companies that went bankrupt, so only recorded survivors, which perform better. And since survivorship can't be predicted well, betting just on Underperformers is a bad idea.
However if the effect is real, then the distribution looks like several VC portfolios I've seen. Average results from most participants and a couple which gave outstanding returns.
I generated a spreadsheet with all this stuff using yahoo prices.