20170318createHistoryFiles AAII-SV-CIMI/20170318createHistoryFiles/
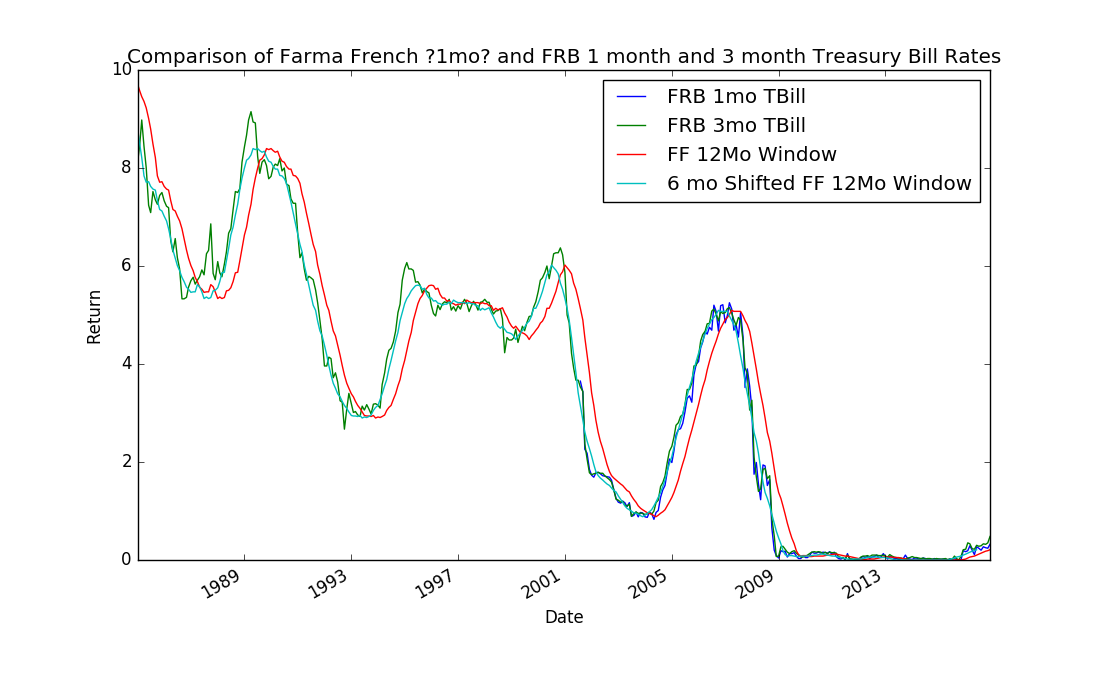
Below is plot of the different Rates that could be used in calculating Dual Momentum.
At the end of the day however, the 3mo Tbill Rates seem to provide the best results.
From portfoliovisualizer's Tuomo Lampinen
The dual momentum model uses the 1-month treasury bill returns for the absolute momentum check.
There are several options for deriving the 1-month treasury bill returns for monthly holding periods, and the calculated returns will vary slightly depending on the methodology used. Consider the following:
1. You buy a fresh 1-month treasury bill from the secondary market at the best end-of-month price
2. You buy a 10-year treasury note that has 1-month left to maturity from the secondary market at the best end-of-month price (note that treasury notes pay interest twice a year, so you have to account for the difference between clean price used for quotes and dirty price that reflects the accrued interest).
3. You calculate the 1-month treasury bill return based on the annualized constant maturity yield
4. You calculate the 1-month treasury bill return based on the annualized secondary market yield
All of the above are different ways of arriving to a 1-month holding period return for a risk free asset, and the returns should be very similar. Since the 1-month treasury bill history does not go that far back, you would need to use option #2 above or a published yields for longer term treasuries (e.g. 3-month t-bill history goes to 1980s) to calculate 1-month holding period returns prior to 2000. You may also find this information useful: https://www.treasury.gov/resource-center/faqs/Interest-Rates/Pages/faq.aspx
One thing that makes a big difference in the dual momentum returns is the use of S&P 500 TR as the leading indicator for foreign stocks. Using single momentum means that the absolute momentum test for all assets is based on a single asset. In Gary Antonacci's Dual Momentum book the proposed model is based on US stocks, international stocks and total bond market. In the proposed model instead of testing both US stocks and international stocks against the absolute momentum filter separately, only US stocks are tested against the absolute momentum filter, and if they pass the filter, then the selection between US and international stocks is based on relative strength. This is based David Rapach, Jack K. Strauss, and Guofu Zhou 2013 paper (International Stock Market Return Predictability), in which they find that the US stock market leads the world markets even at the monthly frequency. You can find more information in the methodology section of the FAQ (https://www.portfoliovisualizer.com/faq#methodology), and the relevant section in the Dual Momentum book is the paragraph or two immediately before Table 8-3 and Figure 8-2 (note that this is different from the Figure 8.4 in Chapter 8) in case you have the book. If you open the Dual Momentum example from the Examples section (https://www.portfoliovisualizer.com/examples), you will notice that the backtested results are better when VFINX is used as the single absolute momentum asset as proposed in the book.
MonthlyTBillRates